Trace
AI Incident Investigation Workspace
Trace is an AI-native investigation workspace that helps engineers understand production incidents, inspect the evidence behind AI-generated hypotheses, and challenge or steer the investigation.
Next.js / TypeScript · FastAPI · LangGraph · Vertex AI · Cloud Run · Cloud SQL + pgvector · Cloud Monitoring / Cloud Trace

When something breaks in production, an engineer has to pull together telemetry, deployment history, logs, and traces, then form a hypothesis about what actually went wrong, under time pressure and often without full context on the system.
AI agents can help by proposing root causes faster than a human working alone.
But a hypothesis without visible reasoning is hard to trust in an incident.
An engineer needs to see the evidence behind a claim, weigh it against alternatives, and push back or redirect the investigation when something looks wrong. Trace is built around that need: investigation as something you can inspect and steer, not just read.
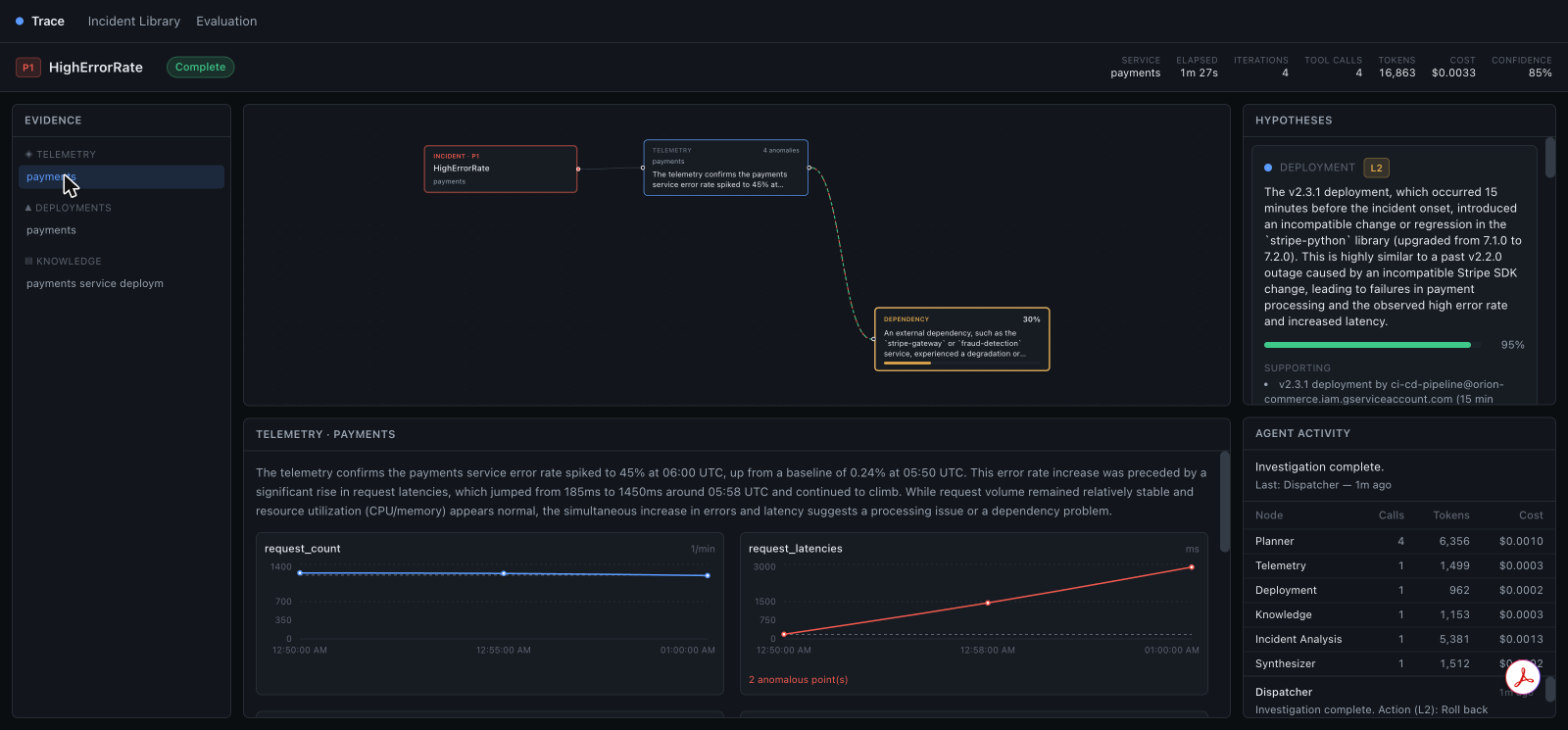
An investigation workspace, not a chat transcript.
Trace lays an incident investigation out as a branching workspace rather than a linear chat. Agents work the incident in the background, pulling telemetry, deployment, and trace evidence, while the engineer watches hypotheses form, compares them side by side, and drills into the evidence behind any one of them.
At any point the engineer can accept a hypothesis, reject it, or challenge it and send the agents back to investigate further. That keeps a human in the loop on the actual root-cause call, not just the final summary.
The moves that make it feel steerable.
Multi-agent investigation
A team of agents work an incident in parallel, each pulling and reasoning over a different slice of evidence.
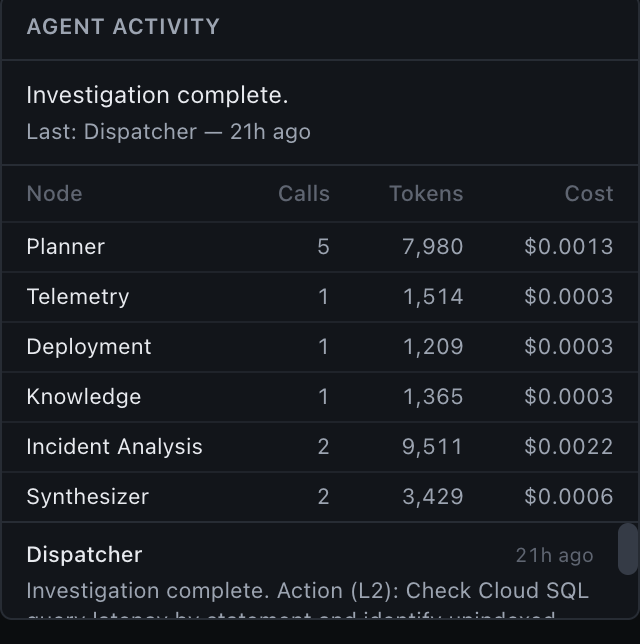
Investigation & evidence graph
Evidence and reasoning steps are laid out as a graph, so you can see how the investigation branched and where it converged.
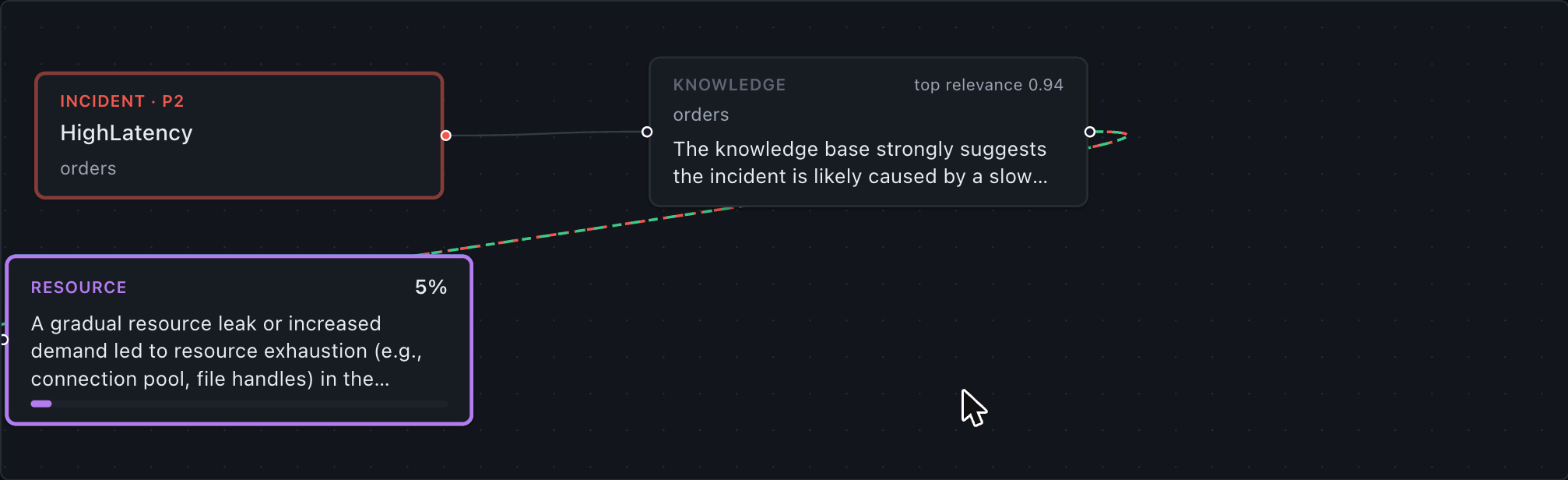
Telemetry & deployment evidence
Cloud Monitoring and Cloud Trace data, plus deployment history, surfaced directly alongside the hypotheses they support.
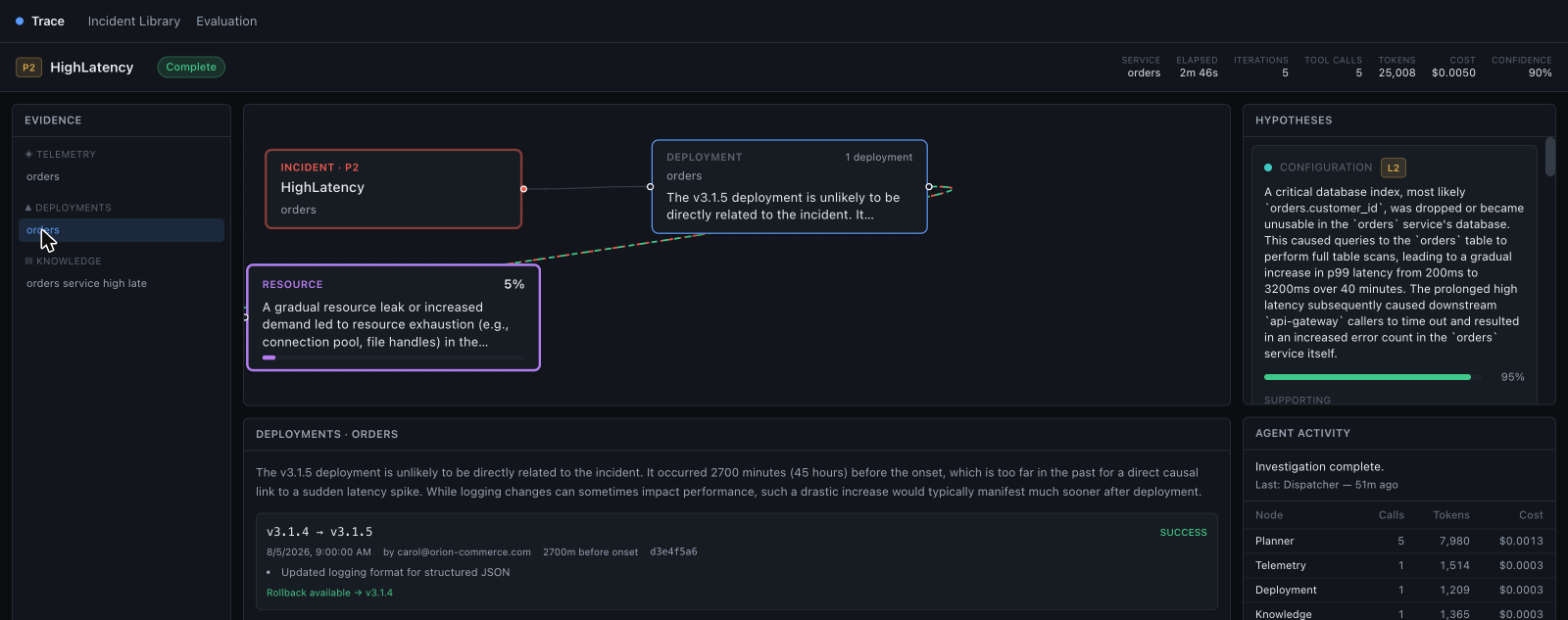
Competing hypotheses & confidence
Root-cause hypotheses are shown side by side with their supporting evidence and a confidence score, not as a single answer.
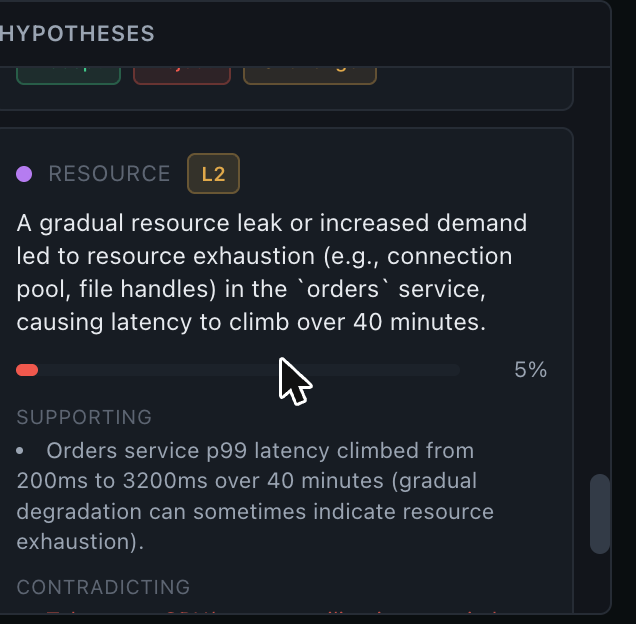
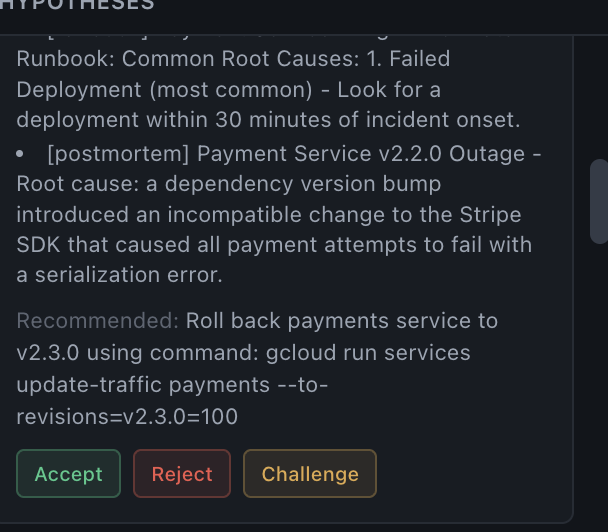
Accept / reject / challenge
Every hypothesis carries a dispatch level: low-risk findings (L1) resolve automatically, L2 auto-applies with a logged action, and L3 findings, the ones that matter, wait for an engineer to accept, reject, or challenge them.
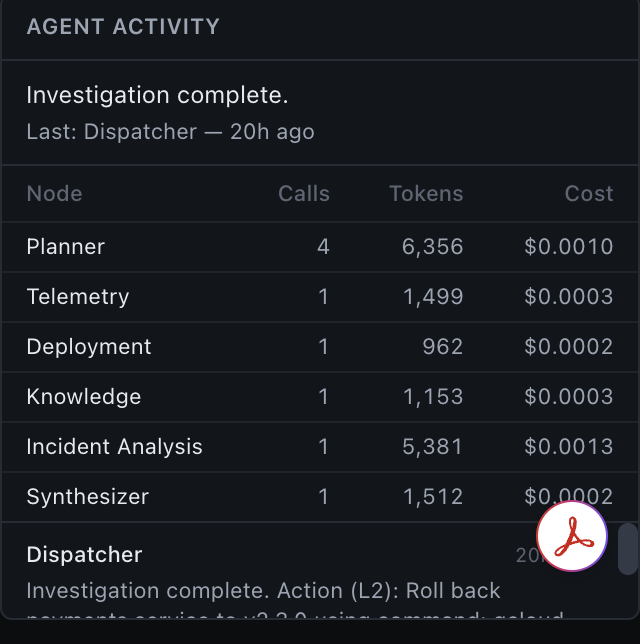
Agent activity & observability
A live view into what each agent is doing and why, so the investigation is never a black box.
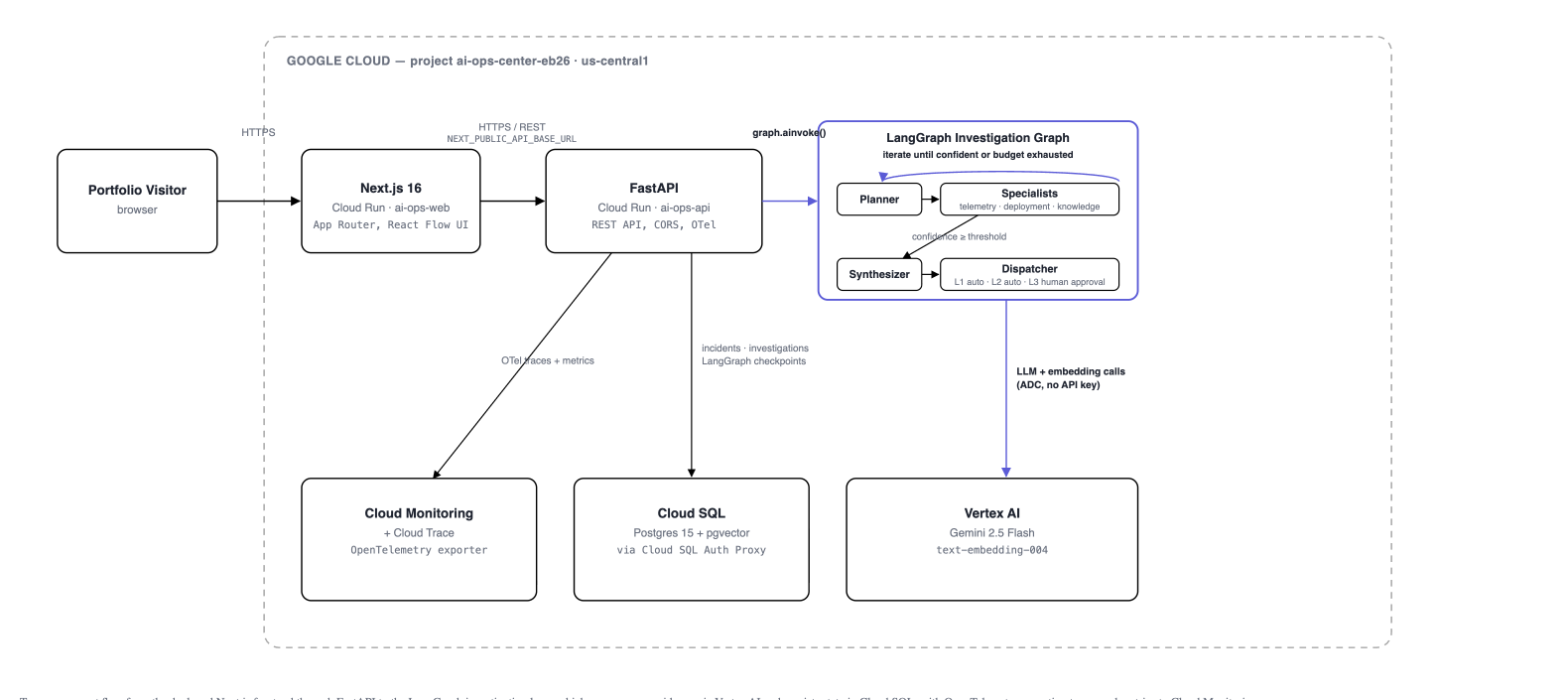
A LangGraph agent stack, evidence in pgvector, both sides on Cloud Run.
The frontend is a Next.js 16 app; the backend is a FastAPI service orchestrating a LangGraph investigation graph: a Planner routes to Telemetry, Deployment, and Knowledge specialists, which feed a Synthesizer and, ultimately, a Dispatcher. Agents call Vertex AI (Gemini 2.5 Flash for reasoning, text-embedding-004 for retrieval), and store and retrieve evidence (telemetry, traces, deployment history) in Cloud SQL (Postgres 15 + pgvector). Both services are deployed publicly on Cloud Run, with OpenTelemetry traces and metrics flowing to Cloud Monitoring and Cloud Trace.
The Dispatcher gates each finding by confidence: L1 resolves automatically, L2 auto-applies with a logged action, and L3 waits for a human to accept, reject, or challenge it; that split is what keeps an engineer in control of the actual root-cause call.
Cloud Monitoring / Cloud Trace → FastAPI + LangGraph agents → Vertex AI → Cloud SQL + pgvector → Next.js frontend
↳ the Dispatcher is the part I'm proudest of
Checking investigations against known outcomes.
Trace is evaluated against replay fixtures (past incidents replayed through the system with a known, ground-truthed root cause) to check whether the investigation converges on the right answer.
All 3 ground-truthed replay fixtures currently resolve to the correct root-cause category.
This is accuracy on the current evaluation fixture suite (3 replay fixtures), not a general production accuracy claim. The suite is small and will grow as more incidents are ground-truthed.
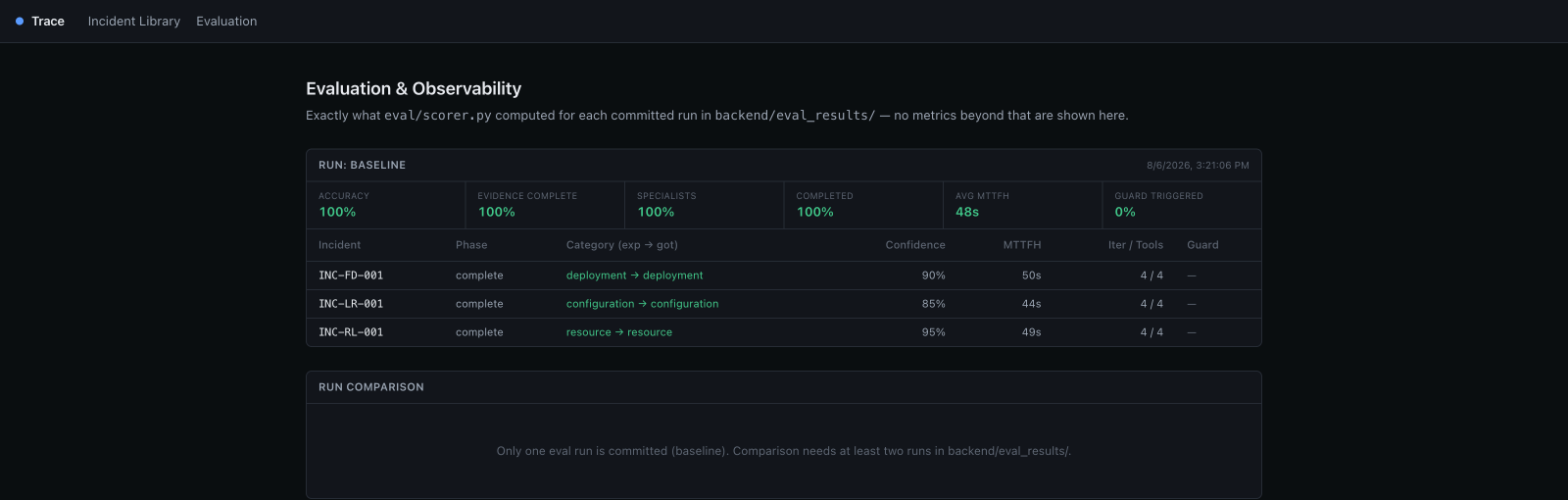
Output of the committed baseline run: what eval/scorer.py recorded for each fixture in backend/eval_results/.
Findings in progress.
Structured user testing hasn't happened yet. This section will be updated with real feedback, iteration notes, and before/after changes once testing sessions are run. No results to report here yet.
See it running.
Trace is publicly deployed: frontend and backend both live on Cloud Run. Try it yourself.